I stumbled when presenting data at work. I used default graphs from the tools, picked up pre-defined theme colors. Worst of all, I jumped straight to the graph with data without thinking what I wanted my audience to get from it.
Those are all common pitfalls when we present data. As a UX designer, we approach problem spaces from understanding the users first. We should approach other areas in our life in the same way. A post from co.design talks about how to design your life with UX methodology. Another post I read talks about why a design manager should approach team management the same way we tackle design issues. Same thoughts are applicable when presenting data.
For those who had the same hardship as I do, I would highly recommend you to read Cole Nussbaumer Knaflic’s “Storytelling with data”. According to Cole, visual storytelling with data shouldn’t begin with data, but with the context, the audience, and the big picture story that you want to tell.
Below are some key takeaways after reading the book:
- Think about the context for the need to communicate, before jumping into the tool and start creating graphs. Think about who is your audience, what do you need your audience to know or do, how to use the data that is available to help make your point.
- Avoid using default graph styles without thinking. Tools are created to cover general use cases, but mostly like is not curated to they story you want to tell. “There is a story in your data. But your tools don’t know what that story is.”
- Choose an effective visual. Use only those graphs that are effective for communication. Cole found herself kept using only certain graphs.
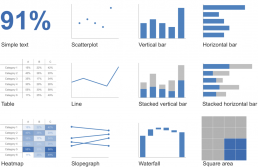
- Never use 3D. 3D skews the numbers, making them difficult or impossible to interpret or compare. Also, don’t use donut charts, or pie charts, use simple bar chart.


- Choose the right graph. Here is a pro tip: choose whatever will be easiest for your audience to read.
- Highlight the important stuff and eliminate distractions.
- Get rid of unnecessary clutter. Clutter makes the visual appear more complicated than necessary. Every simple elements on the screen takes your audience brain power to process. Therefore, every single element on the chart that is not adding informative value need to be removed. This reduce the content-to-chrome ratio, helps the true information stands out.
- When designing the graph, consider the old good Gestalt Principles of Visual Perception: Proximity, Similarity, Enclosure, Closure, Continuity, Connection.
- Intentionally guide the audience’s eyes using pre attentive attributes like orientation, shapes, length, width, size, etc. These help us enable our audience to see what we want them to see before they even know they’re seeing it.
- Create visual hierarchy.
- Use color sparingly and consistently.