My Role
As the only UX/UI designer of a 4-person team, I led the UX/UI design of this mobile app and worked with 3 teammates, consisting of students from computer science, biostatistics, to enhance existing biosurveillance capability and mitigate impacts of threats to public health.
THE CONTEXT
We All Know Surveillance Is Important
Because the impact of an outbreak can be wide-reaching and may occur at the national or regional level. For example, in 2008, the melamine contamination of dairy products in China caused 300,000 illnesses in China, 860 infants hospitalized, 6 infants died. Eventually, over 25 countries ceased to import Chinese dairy products.
THE PROBLEM
But Surveillance System Is Not Robust Enough
Traditional indicator-based surveillance works well for monitoring known risks, but less effective for new or emerging diseases. Therefore, it is complemented with event-based monitoring. Event-based surveillance is the organized and rapid capture of information about events that are a potential risk to public health. This information can be rumours and other ad-hoc reports transmitted through formal channels (i.e. established routine reporting systems, ProMED Mail) and informal channels (i.e. media, health workers and nongovernmental organizations reports).
Event-based surveillance systems rely on the immediate reporting of events and is designed to detect 1) Rare and new events that are not specifically included in indicator-based surveillance. 2) Events that occur in populations that do not access health care through formal channels. However, there are some issues of these event-based surveillance systems: a. The resources are informal and unstructured sometimes; b. Media reports events based on newsworthiness and not necessarily on the public health importance; c. The coverage could be limited in some countries.
THE CHALLENGE
Resources, Newsworthy, Coverage
Informal Resources
Information comes from various online resources, some are informal, unstructured that needs analysis and verification
Less Newsworthy
Media reporting criteria is based on the newsworthiness of the event and not necessarily on the public health importance.
Limited Coverage
In countries with heavily restricted or controlled media, public health events may not be detected and picked up as frequently.
Process Highlights
To design for a type of professionals that we lack the background knowledge, and come up with a tool that is really what they want is hard. We read books, interviewed subject matter experts, to get enough knowledge needed. We were extremely interested how they verify diagnosis and confirm outbreak, based on what information and their process. Our research into that shows they are interested in 5 W’s when it comes to descriptive epidemiology – What, Who, Where, When, Why. An epidemic curve will be constructed to see the trend of the disease. Signs/symptoms, incubation period, route of transmission are all useful information that when formulate and analyze hypothesis. Those could help them find if the cases have a common link or are the same illness, if there is, then this might be an outbreak, and an investigation should be started. They also need to conduct additional studies, follow up cases for additional details. Using insights from the understanding phase, the design goal, user scenario, and ideations were generated.
Professionals who travel around the world conducting medical missions
Medical professionals like doctors, epidemiologists, and public health officials who travel around the world conducting medical missions, are extremely knowledgeable about the diseases, thus could provide first-hand trusty disease reports, even in countries where the disease cases are less likely to be detected by an event-based surveillance system.
THE DESIGN
Wireframe
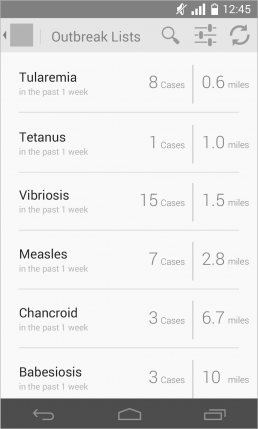
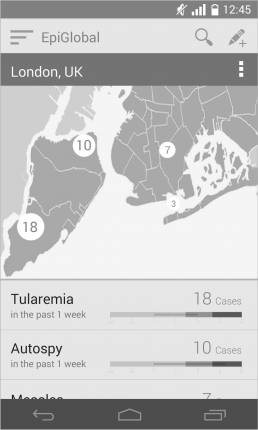
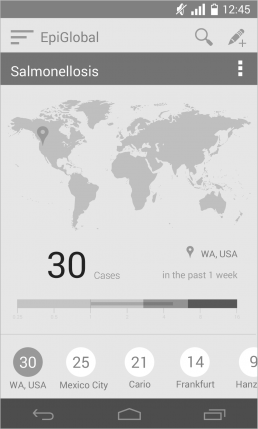
Since we only have 10 weeks, wireframe was first generated using actual dimensions of each element so that developers can start building main functionalities of the app while I was working on the coloring skins parallelly.
Visual Design
Once the app name was chosen, I tried some of the experimentation with the logo. I explored with shapes and other elements, you can see here how I play around with the letter E and globe.
The light straight lines represents the first letter of epidemiologist, based on the rectangle it makes up, a perfect circle was drawn, meaning with the help of epidemiologist, we make a better earth, and holding the diseases (the dots insides) from spreading.
Blue was used as the primary color to give users a sense of professional because authority is an important aspect of our app. At the same time, the secondary color, green, delivers the spirit of hope because we are dealing with the disease. To complement the cold colors, we involved red, orange, yellow to make it less cold, and more inviting.


